Indicators
What is EMA? Exponential Moving Average Guide
Learn what EMA is, its difference from SMA, how it's calculated, and how to use it in trading strategies.
April 24, 2026 6 min read
From EMA to MACD, from backtesting to bot integration — learn everything from scratch.

Learn step-by-step what Optimo is, how it works, and how you can trade smarter with strategy optimization.
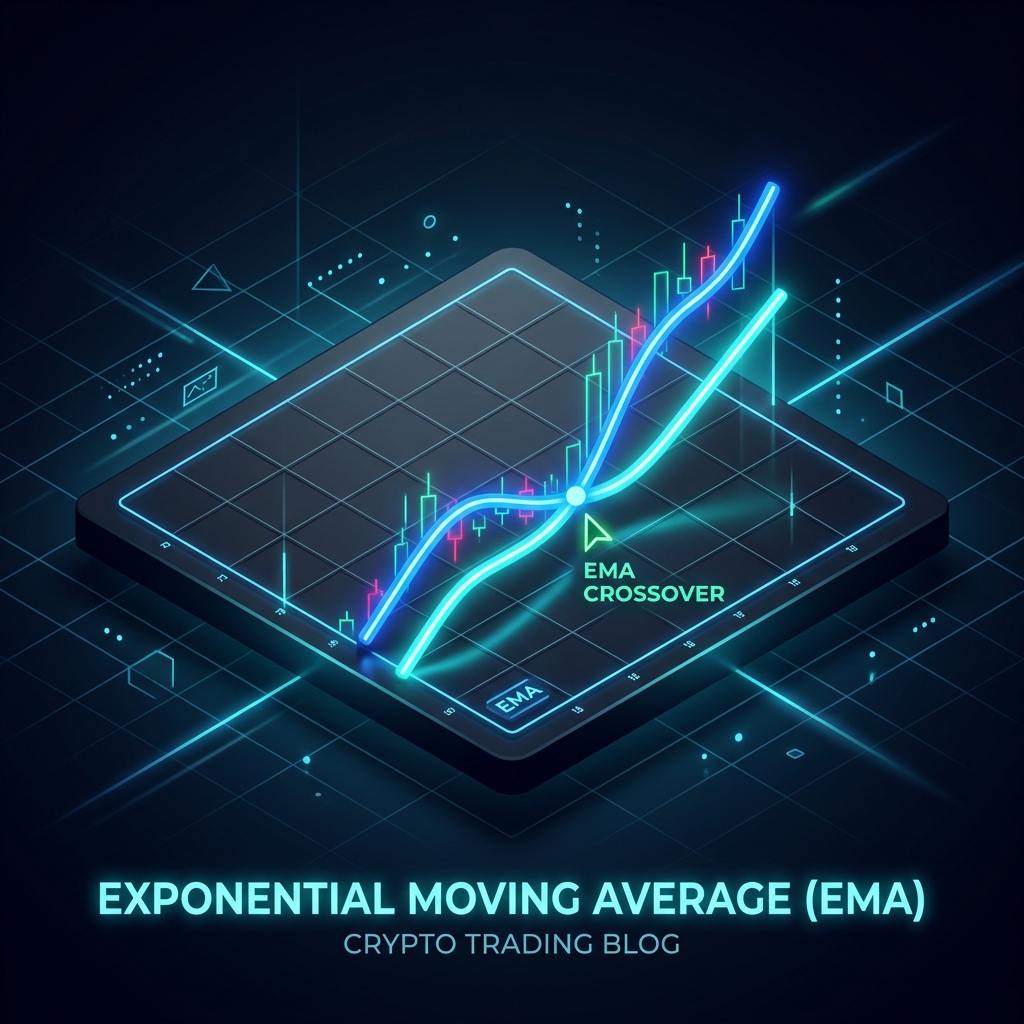
Learn what EMA is, its difference from SMA, how it's calculated, and how to use it in trading strategies.

Learn in detail about MACD's 3 components, its signal generation logic, and its use in trading strategies.

Learn about the RSI indicator, 70/30 levels, divergence signals, and choosing the right parameters.

Learn how Bollinger Bands work, squeeze and expansion periods, and trading signals.

Learn what backtesting is, why it's important, how to interpret it correctly, and why it should be done before risking real money.

Learn how Stochastic is calculated, the %K and %D lines, overbought/oversold signals, and its combination with MACD.

Learn what ATR is used for, how it is used in calculating stop-loss and position sizing, and proper parameter selection.

Learn how On-Balance Volume works, price-volume divergences, and how it is used in trend confirmation.

Learn why VWAP is important for institutional investors, how it is used, and its role in intraday strategies.

Learn the 5 components of Ichimoku, cloud (Kumo) analysis, Tenkan/Kijun crosses, and the most effective usage strategies.

Learn how a trailing stop works, its difference from a fixed stop-loss, and how to set the right percentage.